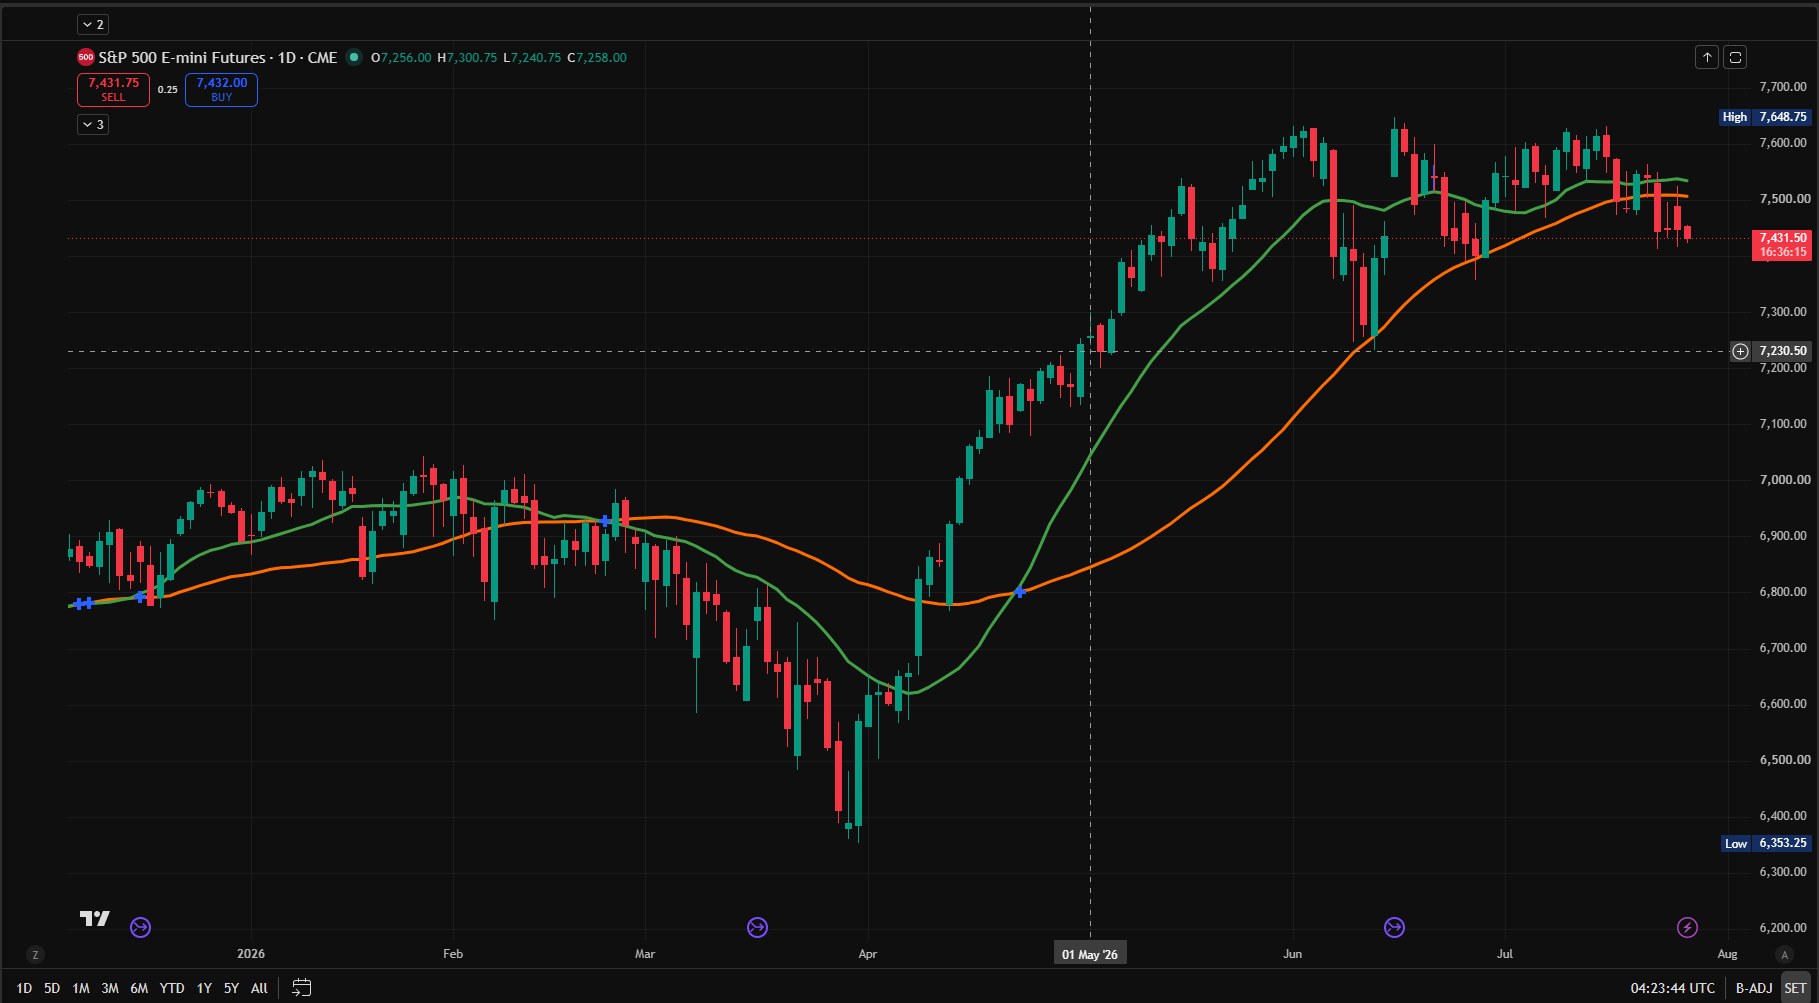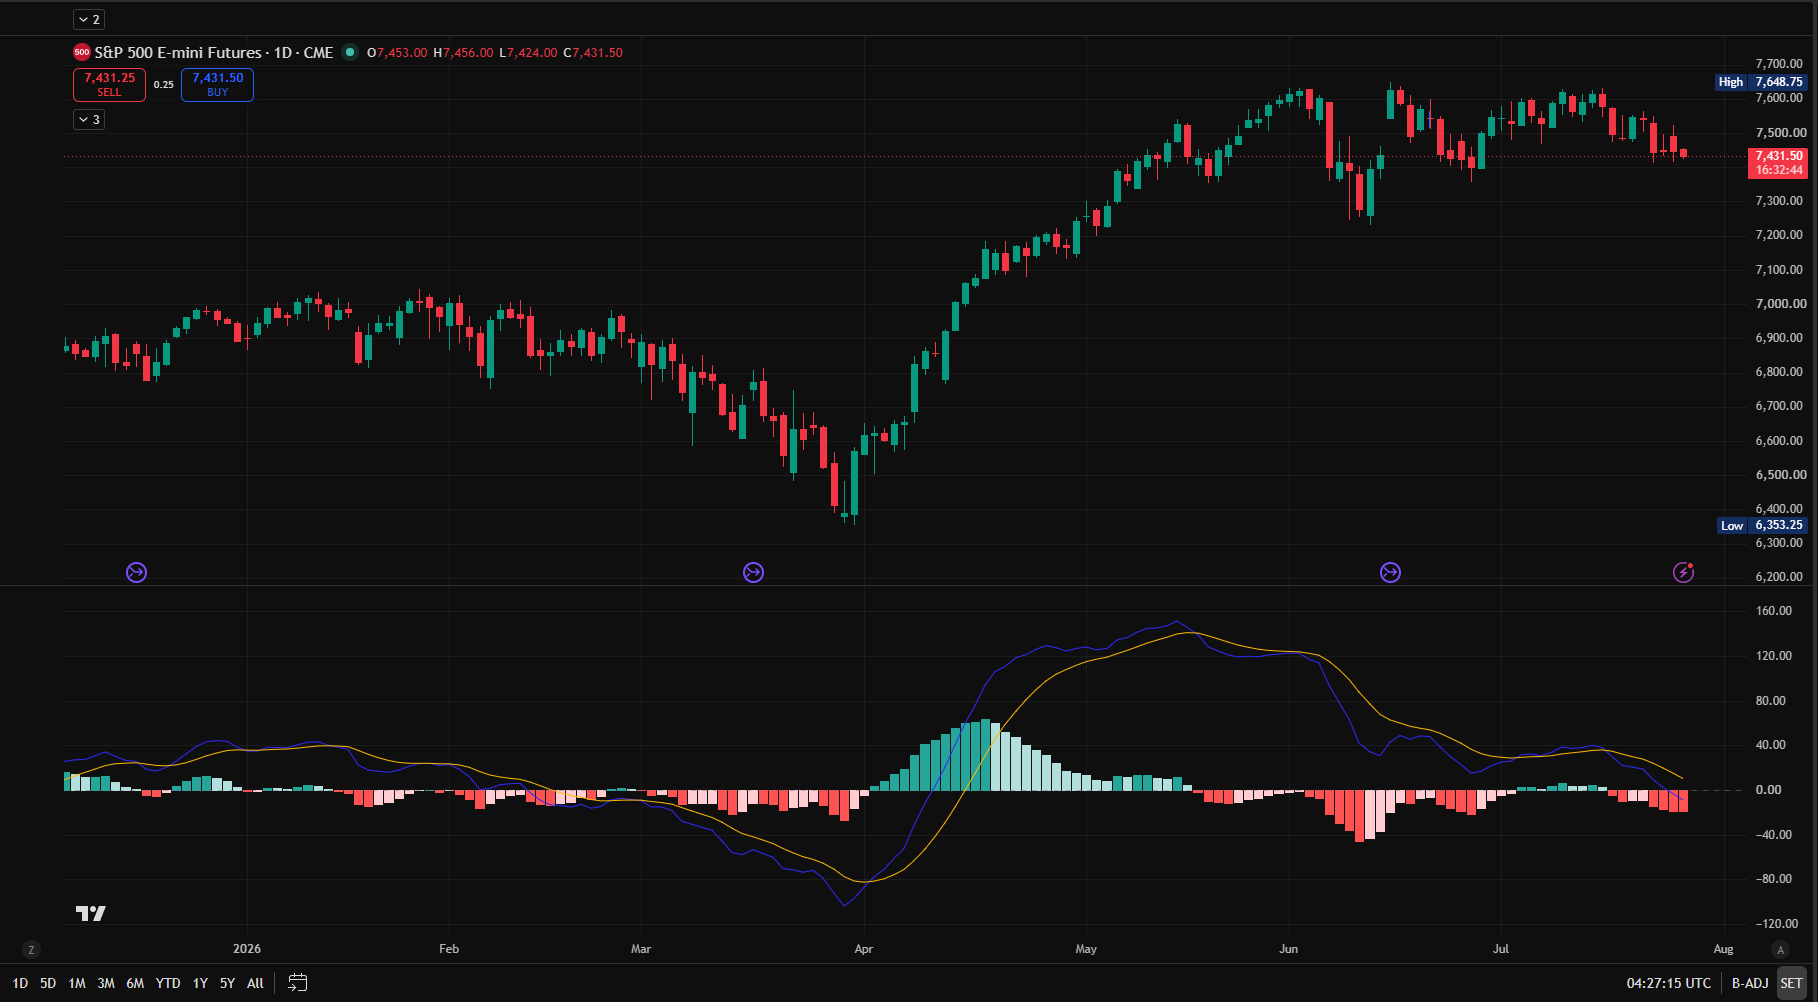
MACD (Moving Average Convergence Divergence) is one of the most popular indicators in technical analysis, yet it’s also one of the most misused. Many traders chase every MACD crossover and end up frustrated with false signals. Understanding what MACD actually measures changes how you use it.
What Does MACD Actually Measure?
MACD measures the relationship between two moving averages (specifically, a 12-period EMA and a 26-period EMA). The MACD line itself is the difference between these two moving averages.
The signal line is a 9-period EMA of the MACD line.
The histogram shows the distance between the MACD line and the signal line.
In simple terms: MACD measures momentum by tracking the gap between short-term and long-term price movement. It’s not predicting future price—it’s describing current momentum.
The Problem With Chasing Crossovers
The most common mistake is trading every MACD crossover. When the MACD line crosses above the signal line, it doesn’t mean price will go up. It means momentum is shifting upward. There’s a difference.
In choppy, ranging markets, MACD can generate dozens of false crossovers as momentum shifts back and forth without meaningful price movement.
How to Read MACD Correctly
Look at the histogram direction: The histogram shows momentum clearly. Growing histogram bars (positive and getting larger) show strengthening upward momentum. Shrinking bars show weakening momentum. When the histogram shifts from positive to negative, momentum has reversed.
Watch for divergence: Divergence is when price makes a higher high but the MACD histogram makes a lower high. This signals weakening momentum and often precedes a trend reversal. True divergence is more powerful than simple crossovers.
Confirm with price structure: A MACD crossover means something only if it coincides with price structure confirmation—a break of support/resistance, a change in candlestick pattern, or momentum at a key level.
Use it as confirmation, not initiation: MACD works best as a confirmation tool. If price is showing a reversal pattern AND MACD shows momentum reversal, that’s a much stronger signal than MACD alone.
Different Uses for Different Timeframes
On daily charts: MACD divergence often precedes significant trend changes. Watch for price making higher highs while MACD makes lower highs—this often signals a coming pullback.
On hourly charts: MACD is more sensitive and generates more false signals. Use it mainly to confirm stronger support/resistance breaks.
On 4-hour charts: MACD works well for swing trading. Divergence signals are often reliable, and crossovers carry more weight because the timeframe filters some noise.
When MACD Works Well
MACD is most reliable when:
- Price is in a strong trending move (not ranging)
- MACD shows clear divergence (not just subtle differences)
- The MACD histogram is clearly growing or shrinking (not oscillating around zero)
- The signal aligns with your major timeframe analysis
When MACD Fails
MACD breaks down when:
- Price is consolidating or ranging—crossovers become whipsaws
- Divergence is subtle (price barely makes a new extreme while MACD barely doesn’t)
- You’re trading against the major trend
- You’re using MACD in isolation without price structure confirmation
Practice Exercise
Pull up a daily chart and add MACD. Observe:
- When does the histogram change direction?
- When price makes a new high, does MACD also make a new high? (If not, that’s divergence)
- How often are there false crossovers followed by immediate reversals?
- When the histogram is very large and positive/negative, what happens next?
Track this for a month and you’ll develop a feel for when MACD signals matter.
Final Thoughts
MACD is a momentum indicator—it shows you the strength and direction of price movement. The traders who master it don’t chase every crossover. Instead, they use MACD to confirm what price structure is already showing them.
Remember: momentum can turn on a dime, but price structure changes more deliberately. Use MACD to time your entries more precisely, not to make decisions on its own.
SkyVestments content is provided for educational and informational purposes only and is not financial or investment advice. Markets involve risk, and individuals should make their own informed financial decisions.
Educational Disclaimer: SkyVestments content is provided for educational and informational purposes only and is not financial or investment advice. Markets involve risk, and individuals should make their own informed financial decisions.