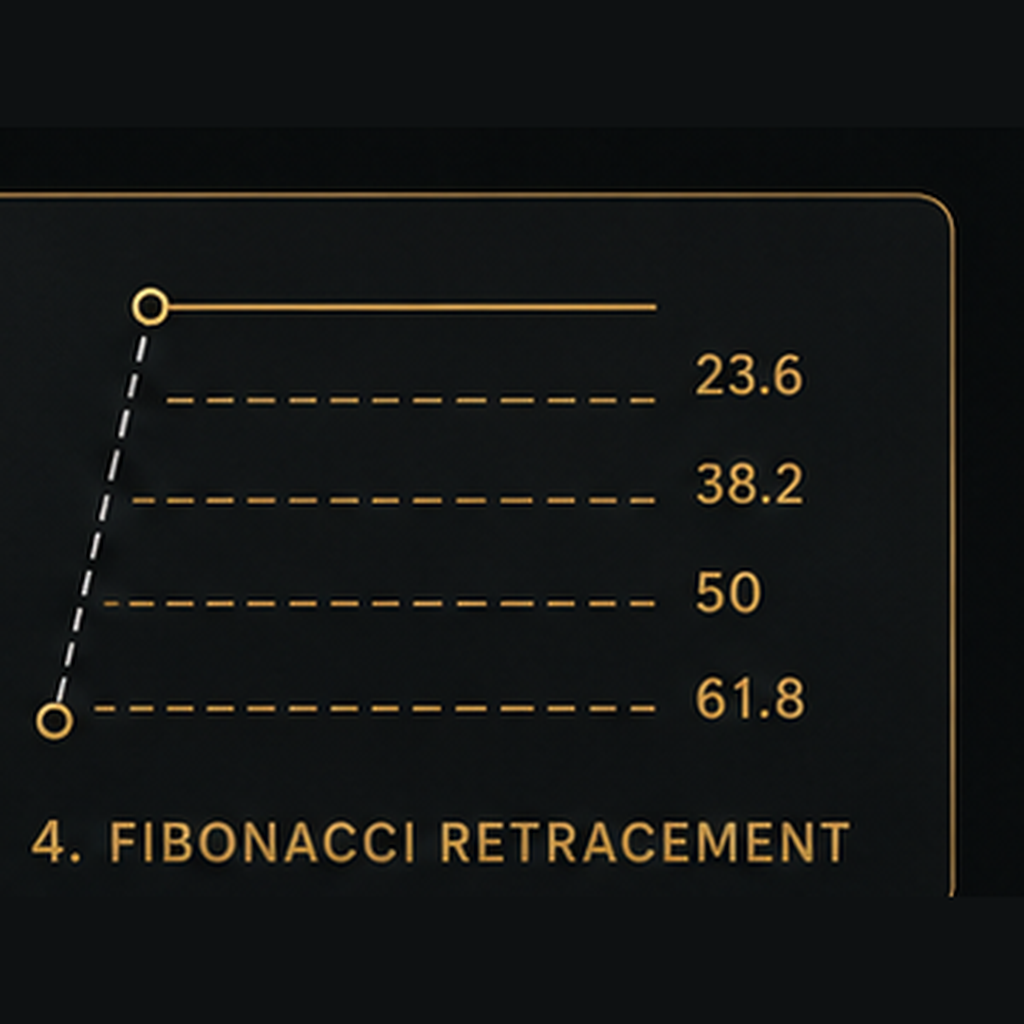
Fibonacci Retracement
A tool for identifying potential pullback areas and price reaction levels during retracements.
What It Does
Fibonacci Retracement helps identify potential pullback areas between a significant price high and low. It uses commonly watched percentage levels such as 23.6%, 38.2%, 50%, and 61.8% to help traders study where price may pause, react, find support, or meet resistance during a retracement.
How to Use It
Choose a meaningful price swing and draw the Fibonacci Retracement from one end of the move to the other. Watch how price behaves around the major retracement levels, especially when those levels line up with market structure, support and resistance, moving averages, volume, or other confirmation.
Do not treat a Fibonacci level as an automatic buy or sell signal. Use it as a reference area within the larger market setup.
Video Lesson
A video lesson demonstrating Fibonacci Retracement in action will be added soon. Check back later for step-by-step examples of how to use this tool effectively in your chart analysis.