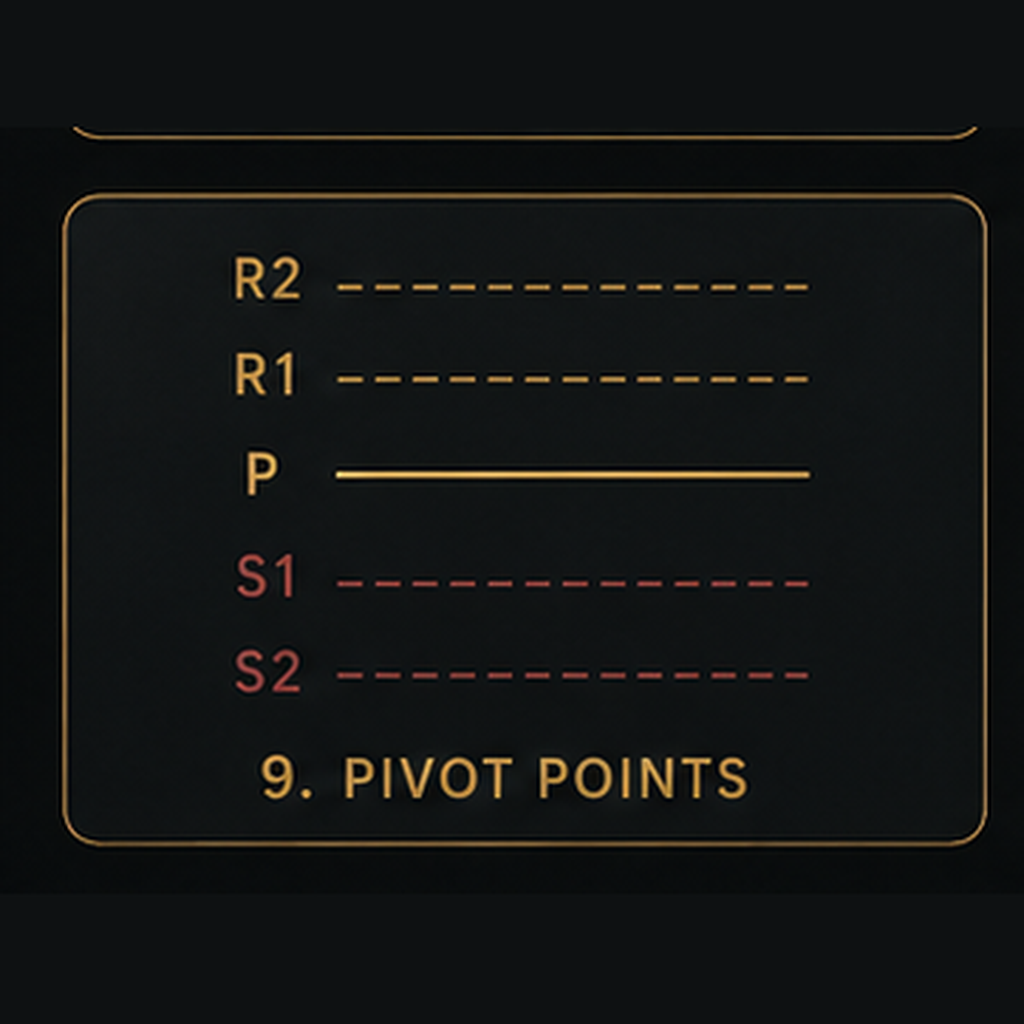
Pivot Points
A tool that calculates reference levels for identifying support, resistance, and potential reaction areas.
What It Does
Pivot Points calculate a central reference level along with additional support and resistance levels using prior market price data. These levels can help traders identify areas where price may react, pause, reverse, or break through.
Common levels include:
P — Pivot Point
R1 / R2 — Resistance Levels
S1 / S2 — Support Levels
How to Use It
Add Pivot Points to the chart and observe where current price is trading relative to the central pivot and the surrounding support and resistance levels. Watch how price behaves when it approaches or interacts with those areas.
Look for:
- • Rejection from a pivot level
- • Breakouts through a pivot level
- • Retests after a breakout
- • Consolidation around a pivot
- • Support becoming resistance
- • Resistance becoming support
- • Confluence with other chart levels or indicators
Pivot Points should be used as reference areas, not as guaranteed reversal levels or automatic trade signals. Combine them with price action, market structure, trend, volume, and other confirmation.
Video Lesson
A video lesson demonstrating Pivot Points in action will be added soon. Check back later for step-by-step examples of how to use this tool effectively in your chart analysis.