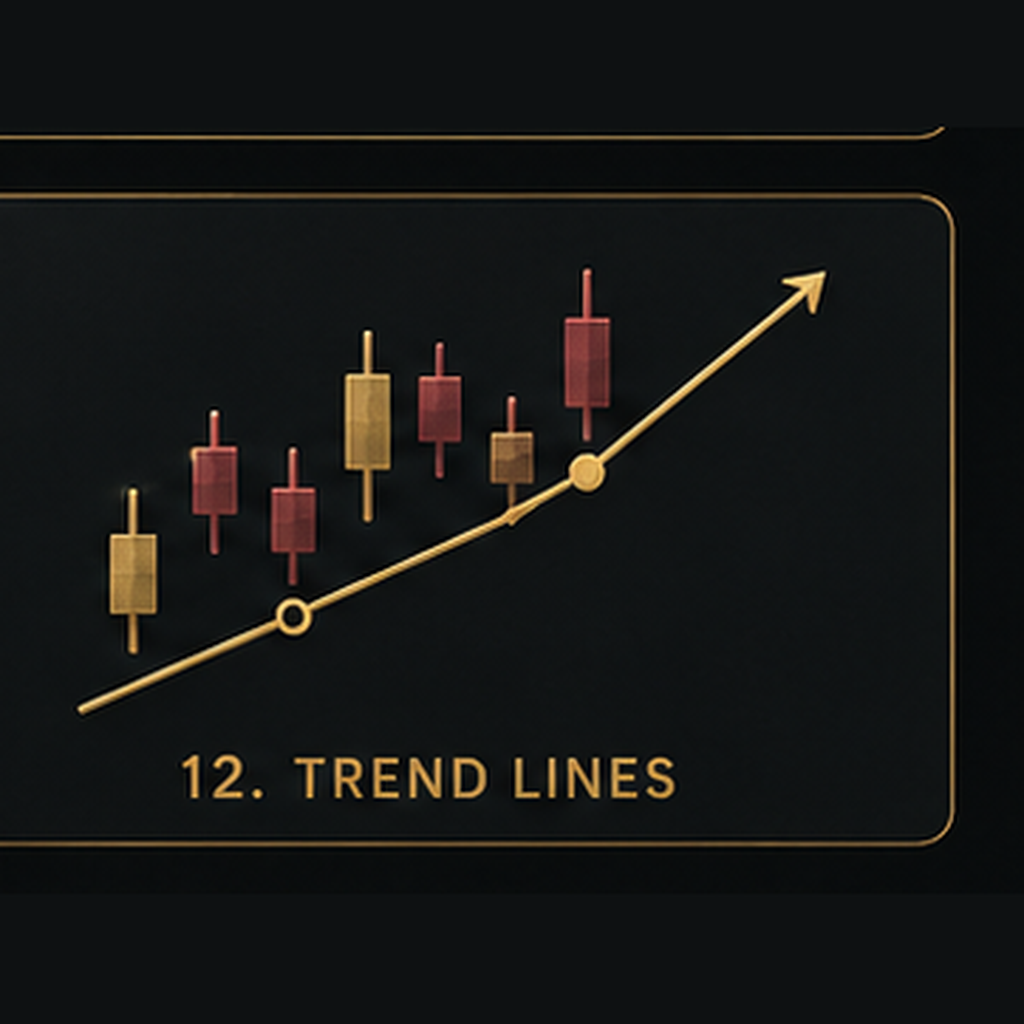
Trend Lines
Connect important price points to identify market direction, structure, and areas where price may react.
What It Does
Trend Lines help traders visually connect important price points and identify the direction and structure of a market move. They can be used to study rising trends, falling trends, support, resistance, channels, and areas where price may react.
How to Use It
Choose meaningful swing highs or swing lows and connect related price points with a line. In an uptrend, traders often connect rising swing lows. In a downtrend, traders often connect falling swing highs.
Watch for:
- • Price respecting the trend line
- • Repeated touches
- • Rejection from the line
- • Breakouts through the line
- • Retests after a break
- • Changes in trend direction
- • Confluence with support, resistance, moving averages, or other chart levels
Do not force a trend line onto the chart just to fit an expected market direction. Use clear price points and allow the market structure to determine whether the line is meaningful.
Video Lesson
A video lesson demonstrating Trend Lines in action will be added soon. Check back later for step-by-step examples of how to use this tool effectively in your chart analysis.