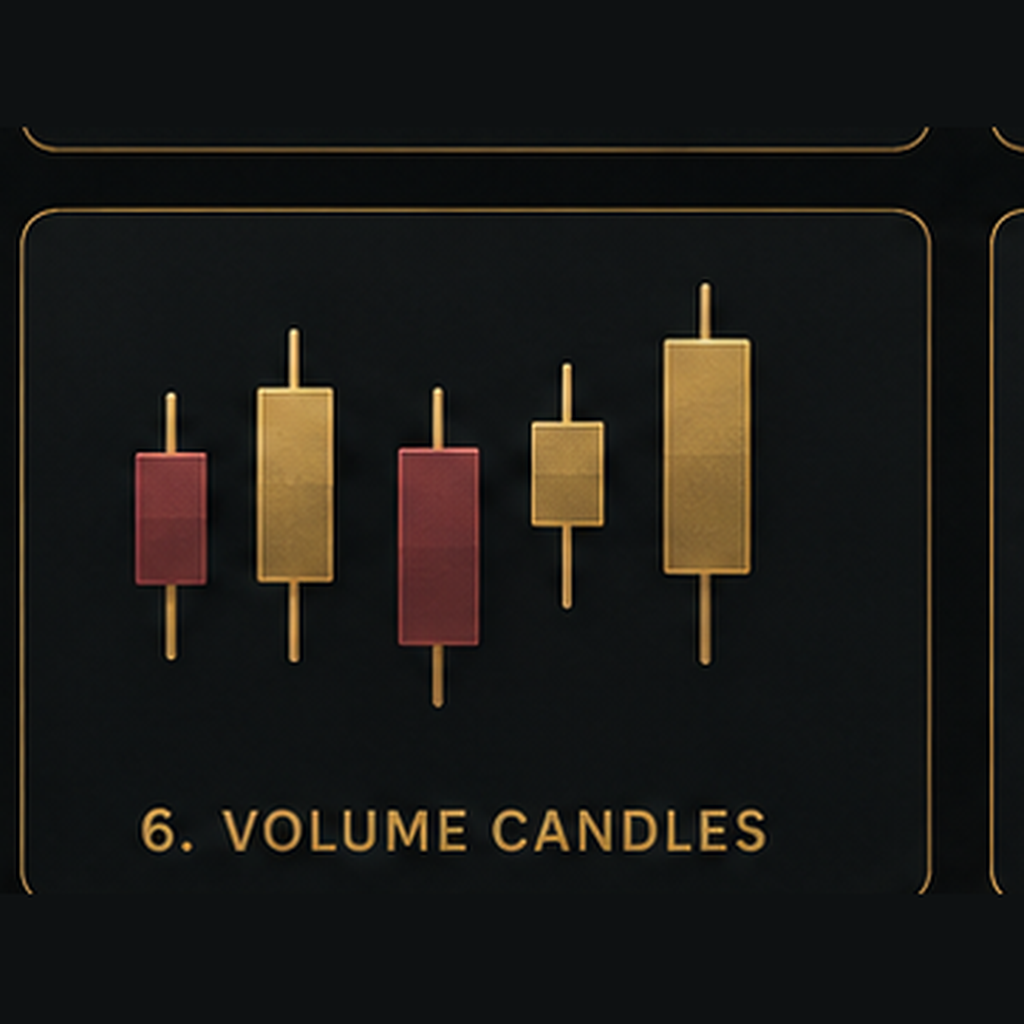
Volume Candles
A chart display that combines price action with trading volume participation in one visual.
What It Does
Volume Candles combine price movement with trading-volume information so traders can see both price action and market participation in one visual. Depending on the chart style being used, candle appearance or width can help show when more or less trading activity is occurring.
How to Use It
Use Volume Candles to compare price movement with the amount of participation behind that move. Pay attention to stronger volume during breakouts, reversals, trend continuation, and important support or resistance reactions. Lower-volume movement can also help show when participation is weaker.
Volume should be used together with price action, market structure, trend, and other confirmation rather than being treated as an automatic buy or sell signal.
Video Lesson
A video lesson demonstrating Volume Candles in action will be added soon. Check back later for step-by-step examples of how to use this tool effectively in your chart analysis.